A function is a relation from set A to B that assigns each element of set A exactly one element in set B.
Testing for functions:
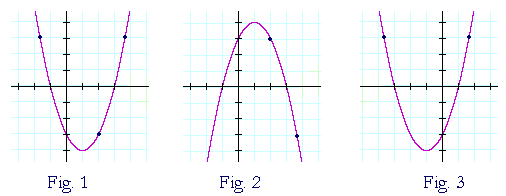
To check to functions on their graphs, one can use the vertical line test:
For each input, there should only be one output.
For each x, there should by only one y.
Domain of a function:
When finding the domain of a function, there are two major things you should look for; denominators equaling zero and the square root of a negative number.
All functions can be graphed and if there is a value of x that makes the y a non-real number, then the function can not be graphed.
Difference Quotient:
The difference quotient the following ratio where:

The difference quotient the following ratio where:

Example:
For the following function, evaluate the difference quotient.

Everywhere there is an x in the function, replace with (x+h).

Then do the same with f(x).

Now your full equation is:

From here, combine like terms and simplify to get:
2x + h - 4
Vertical and Horizontal Shifts
In a vertical shift of a graph, all of the points on the graph will move up or down x units. Take a parabola for example. The parent function is:

If you add or subtract a number from this function, the graph will shift up or down respectively, as shown below.
Likewise, if you take the same parent function of a parabola but add or subtract a number from inside the quantity being squared, the graph with horizontally shift up or down as seen below.
However there is one important point to remember. If you add a number inside of the parentheses, the graph shifts left. If you subtract inside the parentheses, the graph shifts right.

Reflection of Graphs
A graph can either reflect about the x or y axis.
A reflection in the x-axis: f(x) = - f(x)
A reflection in the y-axis: f(x) = f(-x)
Stretching and Compressing
In the graph below, the red line indicates the parent function:
The pink line indicates compressing of the graph by a factor of 3. The leading, highest degree term is multiplied by 3.
The green line indicates stretching of the graph by a factor of 1/4. The leading, highest degree term is multiplied by .25.
If the leading coefficient is greater than 1, the graph will compress. If the leading coefficient is less than 1, the graph will stretch.
Sum of Functions
The sum of two functions is often written as ( f + g ) (x). This statement also means f(x) + g(x). Just simply add the two functions together. If a value for x is given to you, plug that number in, add the functions, and combine like terms.
This same process applies for addition, subtraction, multiplication, and division. Just use order of operations to combine like terms and DON'T FORGET PARENTHESES!!!
Inverse Functions
The inverse is often written as:

This simply means to undo the operations done by the original function. The input into the function will be the output of the inverse function.
In finding the inverse of a function, the first thing to do is substitute f(x) with y. By doing so, you have an equation with an x variable and a y variable.
Here is an example with the original function of f(x) = 2x + 1
Replace f(x) with y:
y = 2x + 1
Switch the x and y variables:
x = 2y + 1
Now, solve for y:
x - 1 = 2y

This answer is correct, however, to write the inverse of a function in correct function notation, substitute y for 
Final Answer:
Be sure to check that your answer is a function (for every x there is only one y) because not every function has an inverse.
No comments:
Post a Comment